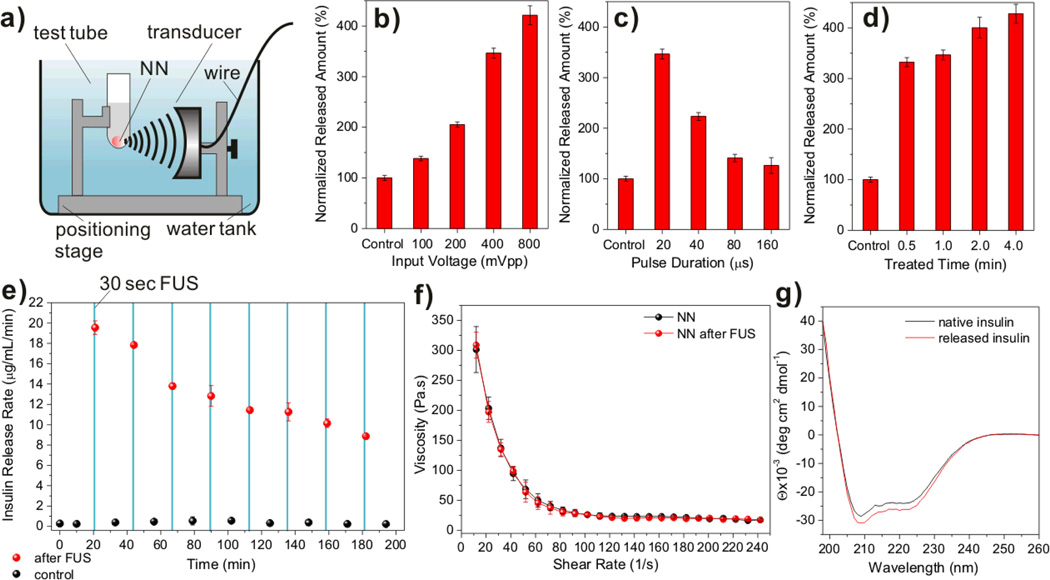
Figure 3. In vitro insulin release of nano-network (NN) triggered by focused ultrasound (FUS).
a) Schematic of the experimental apparatus. b)–d) Normalized insulin release rates upon variation of distinct ultrasound parameters in 1×PBS buffer at 37°C: vary input voltage at fixed time at 30 sec and pulse duration at 20 µs (b); vary pulse duration at fixed time at 30sec, input voltage at 400 mVpp (c); and vary administration time at fixed pulse duration at 20µs and input voltage at 400 mVpp (d). e) The pulsatile insulin release profile of the NN over time by the intermittent trigger of FUS in 1×PBS buffer at 37°C. The red spots indicate the release rate after the FUS treatment for 30 sec (950 kHz; input voltage: 400 mVpp; pulse duration: 20 µs; output power: 4.31 W); the black spots indicate the basal release rate. The blue solid columns indicate the FUS administration window. f) Viscosity and shear-thinning behaviors of the NN before and after FUS treatment. g) CD spectra of the native insulin solution and insulin released from the NN via FUS treatment at 37 °C. Data points in b)-f) represent mean ± SD (n = 3).

