
Figure 2.
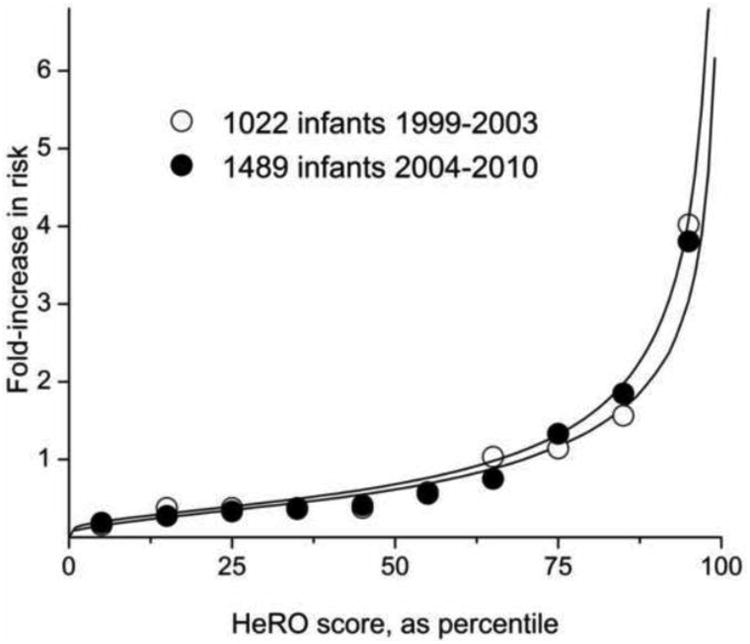
Predictiveness curve for HeRO score in estimating sepsis risk in 2 large populations studied over more than a decade. The solid lines shows measured but non-displayed HeRO scores arrayed from smallest to largest. The circles are the observed fold-increase in risk of sepsis. Open circles are from 1022 patients at 2 NICUs from 1999 to 2003, and filled circles are from 1489 infants at 9 NICUs from 2004 to 2010. Data from 38 and 34.