
Figure 5.
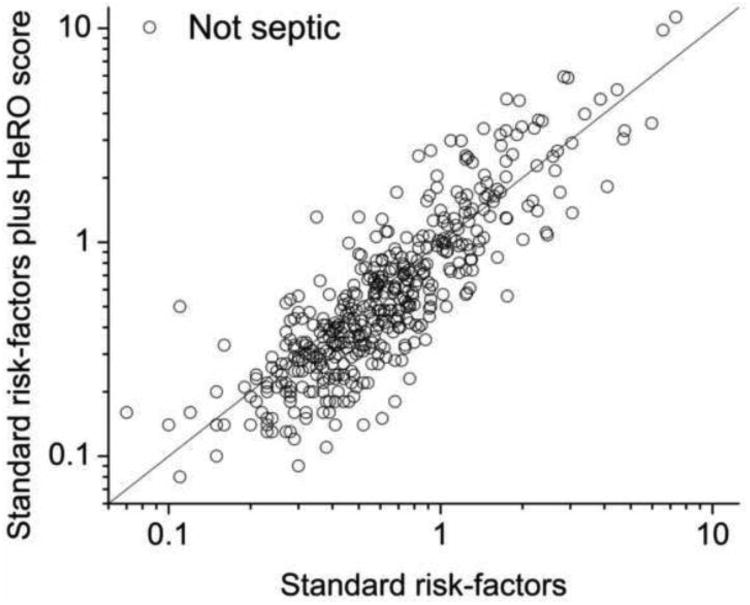
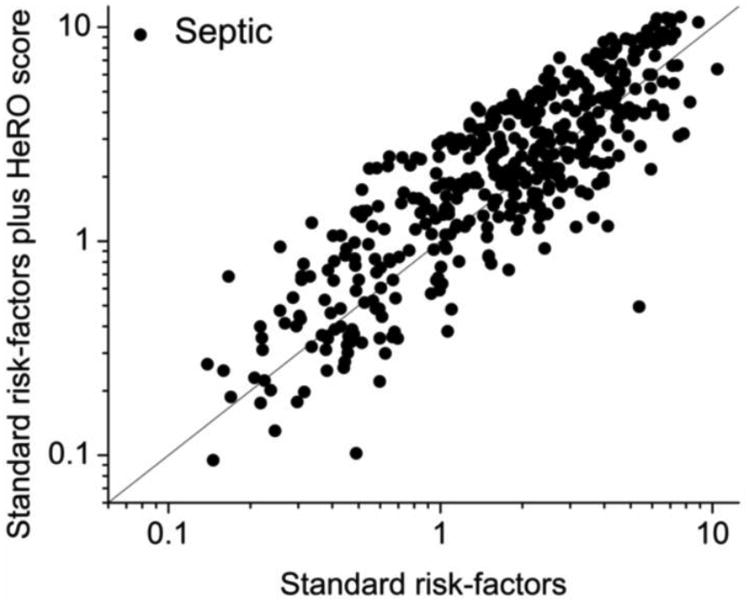

Model predictions with and without HeRO score, for non-cases (panel A) and cases (panel B). Consistent with the probability densities in Figure 4, there is reduction in predicted risk for non-cases when the HeRO score is added. (Panel C). Dependence of the continuous NRI(>x) on the change in HeRO score required for reclassification. More stringent requirements reduced not only the number of reclassified measurements (right-axis, gray steps) but also the NRI (left-axis, solid line and dashed 95% CI).