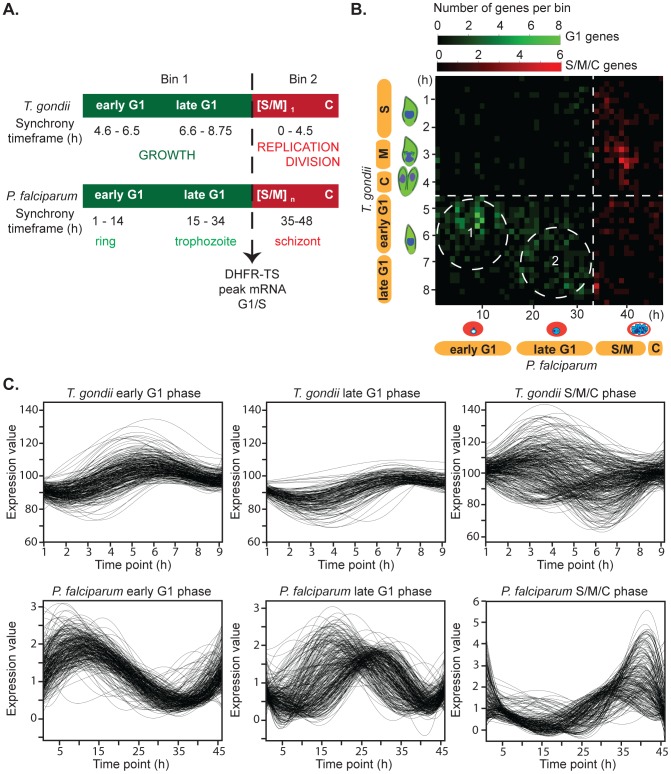
Figure 2. The timing of core drCDC genes defines clusters of co-regulated mRNAs.
[A.] Cell cycle transcriptome data from T. gondii [10] and P. falciparum [9] asexual stages were analyzed, allowing the alignment of the cell cycles by the peak timing of canonical drCDC mRNAs as exemplified by DHFR-TS (dashed line). In T. gondii, tachyzoite replication involves single S and mitotic [S/M] phases followed by parasite budding (cytokinesis = C). In the P. falciparum merozoite repeated rounds of chromosome replication and nuclear division produce multiple merozoites from a single infection. Despite these scale differences in replication, adopting this procedure generates a basic partition of the cell cycles: Bin 1 encompasses mRNAs that peak in G1, while Bin 2 covers mRNAs with maximum expression in S phase, mitosis and cytokinesis. Further sorting of G1 was apparent by the self-clustering of the peak timing of mRNAs encoding transcription and translation (early G1) from those mRNAs encoding known DNA replication factors (late G1): early G1 of T. gondii = 4.6–6.5 h, P. falciparum = 1–14 h; late G1 for T. gondii = 6.6–8.75 h, P. falciparum = 15–34 h; and S/M/C of T. gondii = 0–4.5 h, P. falciparum = 35–48 h. [B.] Pairwise expression timing of all 744 drCDC mRNAs using the alignment scheme of [A.]. The G1/S transition (dashed line) and matched G1 timing is plotted in the lower left quadrant, while matched S/M/C timing corresponds to the upper right quadrant. The relatively few mRNAs indicated in the upper left and lower right quadrants represent drCDC gene pairs with mismatched mRNA timing. Color intensity (green: peak in G1, red: peak in S/M/C) indicates the increase in the number of genes showing similar timing in each cell cycle. In the G1 phase, two clusters correspond to the peak timing of mRNAs. The cluster of paired mRNAs in circle 1 correspond to many general transcription/translation genes, while in circle 2 co-expressed mRNAs are enriched for DNA synthetic factors. [C.] Individual mRNA profiles for co-expressed mRNAs that peak in early G1, late G1 and S/M/C phases are displayed.

