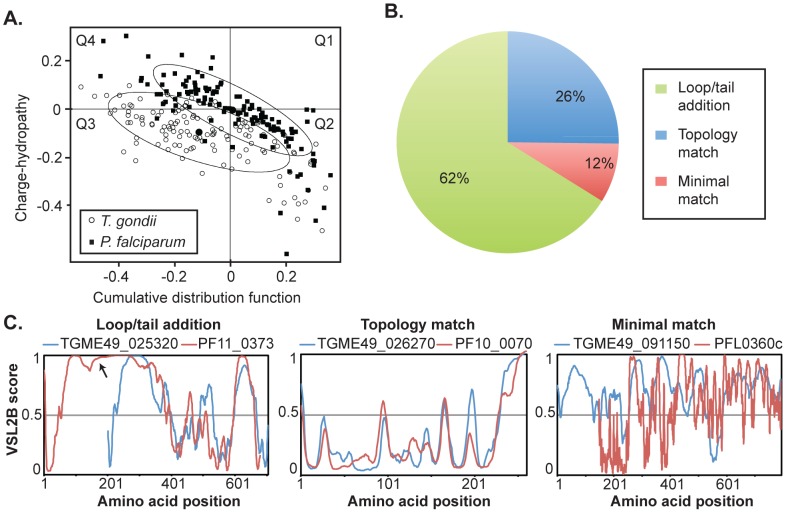
Figure 4. Novel drCDC-UNK proteins have highly conserved structural features.
[A.] CH-CDF analysis of the drCDC-UNK proteins. Here, the coordinates of each point were calculated as a distance of the corresponding protein in the CH-plot from the boundary (Y-coordinate) and an average distance of the respective CDF curve from the CDF boundary (X-coordinate). The four quadrants correspond to the following predictions: Q1 (upper right), proteins predicted to be disordered by CH-plots (positive values), but ordered by CDFs (negative values); Q2, ordered proteins; Q3, proteins predicted to be disordered by CDFs, but compact by CH-plots (i.e., putative molten globules or mixed proteins); Q4, proteins predicted to be disordered by both methods (i.e., proteins with extended disorder). This plot shows that roughly half of the 125 drCDC-UNK proteins are expected to be disordered as a whole with the degree of disorder slightly higher in T. gondii. The ellipses encompass 80% of the data points for each species: P. falciparum = closed squares, T. gondii = open circles. [B. and C.] The 125 drCDC-UNK pairwise disorder/order alignments sorted into three general categories. An example of an ortholog pair displaying loop/tail additions, compared to topologies that closely match versus a pair that minimally matched. Order/disorder plots (VSL2B scores, >0.5 = disordered) for T. gondii (blue) versus P. falciparum (red) proteins were aligned by best-fit methods. Pairwise graphs for all 125 drCDC-UNK proteins are included in Supplemental Information.

