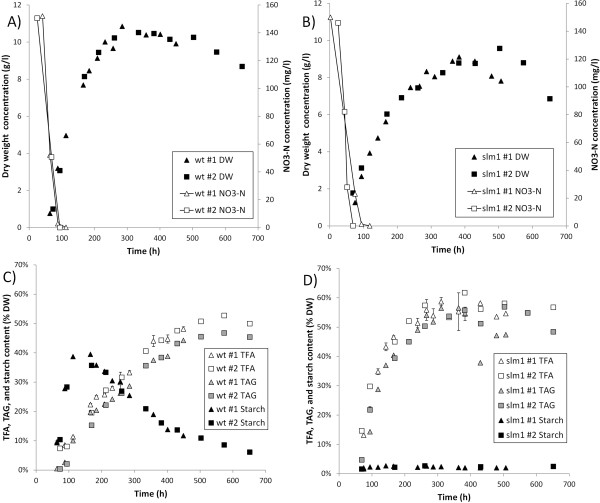
Figure 1.
Duplicate batch nitrogen run-out cultivations of the wt and the slm1 S. obliquus. Left (A, C): wild-type. Right (B, D): slm1. Top (A, B): biomass concentration (g DW/l) and dissolved NO3-N concentration. Bottom (C, D): total fatty acid (TFA), TAG, and starch content. As indicated in the legend boxes in the figure, in the top figure, the black symbols represent the dry weight concentration and the open symbols represent the NO3-N concentration. In the bottom figures, the open symbols represent the total fatty acid content (TFA), the gray symbols represent the TAG content, and the black symbols represent the starch content. The results indicated with #1 and #2 in the figure legend represent the replicate cultivations.

