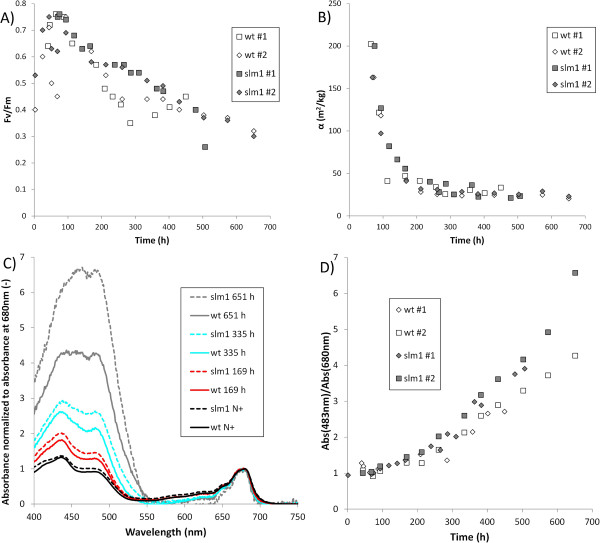
Figure 4.
Impact of nitrogen starvation on photosynthesis. (A) Fv/Fm ratio. (B) Absorbance cross section. (C) Absorbance spectrum of the slm1 and wt under nitrogen replete and nitrogen depleted conditions, normalized to the absorbance at 680 nm. (D) Ratio of absorbance at 483 nm and 680 nm. In figure C, the time indicated in the figure legend represents the time after inoculation. Nitrogen starvation commenced 70 to 100 h after inoculation. The spectrum that is indicated with N+ in the figure legend represents the spectrum before nitrogen was depleted. Open symbols indicate the wt and gray symbols indicate the slm1. The results indicated with #1 and #2 in the figure legend represent the replicate cultivations.

