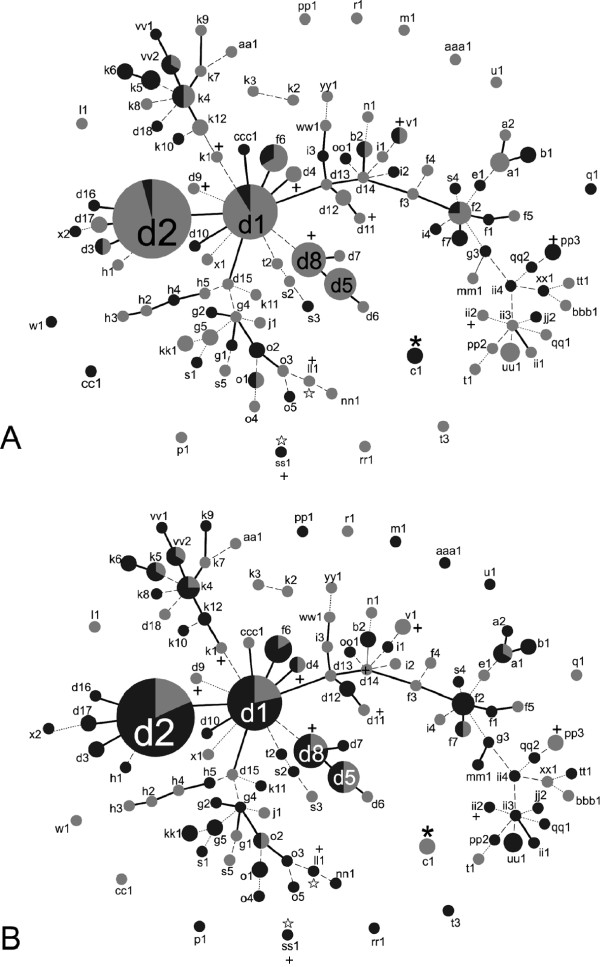
Figure 2.
Population snapshots of F. keratoplasticum inferred using Phyloviz beta. Each node represents a unique ST (the prefix ″2-″ has been omitted for clarity); areas of nodes are proportional to the number of isolates. STs with 8/9 loci in common (SLVs) are connected with solid black lines, STs with 7/9 loci in common (DLVs) are connected with dashed lines, STs with 6/9 loci in common (TLVs) are connected with dotted lines. STs different at more than three loci not connected to a group. 9 SLV groups are shown. In A) light gray indicates proportion of STs that are MAT1-1; darker gray shading indicates proportion of STs that is MAT1-2. In B) light gray indicates isolates from clinical sources; darker gray indicates isolates from all other sources. Plus signs denote several STs containing isolates known to produce cyclosporin in vitro. Asterisks denote the ST of the ISO standard ATCC 36031 strain. White stars denote STs containing isolates successfully crossed in mating experiments.

