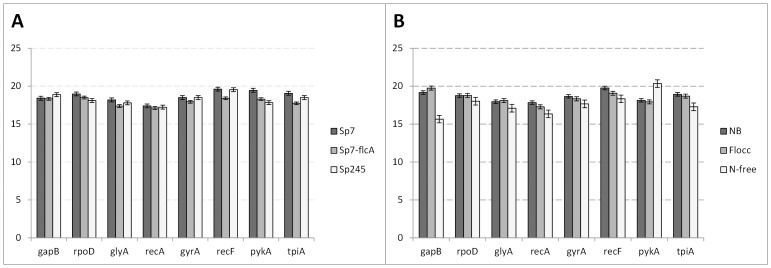
Figure 2. Expression levels of reference gene candidates.
A: Expression of reference genes across A. brasilense strains. B: Expression of reference genes across different culture conditions. Gene expression levels are represented by average Ct values. NB: nutrient broth; Flocc: Flocculation medium; N-free: Nitrogen free medium. Each bar represents the mean Ct values from three independent experiments. Error bars indicate standard error.

