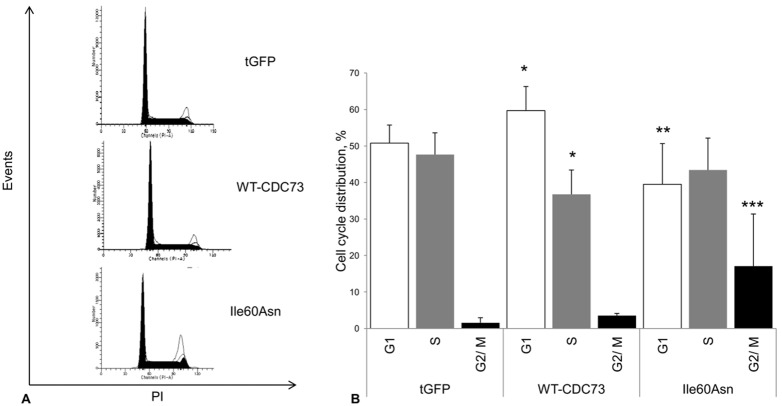
Figure 7. Flow cytometry analysis of cell cycle in transfected HEK293A cells.
Cell cycle analysis with flow cytometry. HEK293A cells were transfected with the control vector (tGFP) or fusion proteins of tGFP with wild-type (WT-CDC73) or Ile60Asn mutant parafibromin (Ile60Asn), and the analysis was performed 48 hours after transfection. A. Flow cytometric analysis plotting cell number vs. intensity of propidium iodide (PI) signal from a representative experiment. B. Histograms showing the percentages of cells in the different phases of cell cycle. Values shown represent mean and standard deviations of pooled results from 4 independent experiments; *, P<0.05 compared to control cells; **, P<0.05 compared to wild-type parafibromin transfected cells; ***P<0.05 compared to both wild-type parafibromin-transfected cells and control cells.

