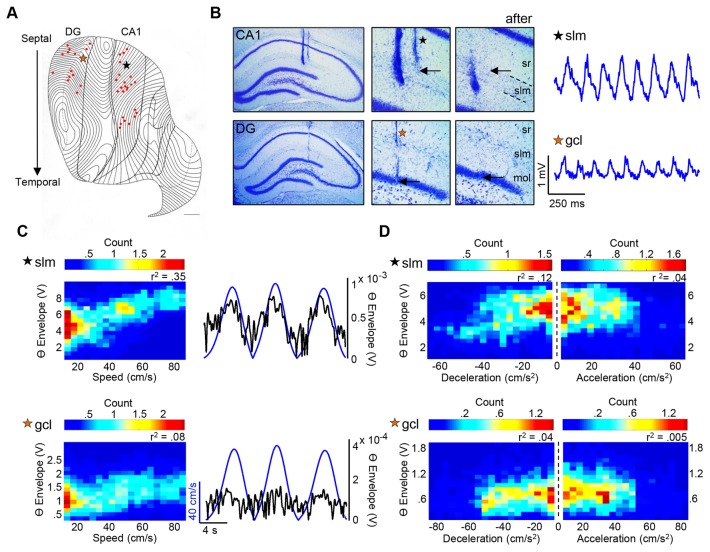
Figure 2. Electrode locations, corresponding theta traces & relationship between theta amplitude and speed/acceleration/deceleration.
A: Flatmap representation of the hippocampal formation. Electrode placements are indicated as red dots. Each contour line represents a coronal section. Orange star denotes DG electrode as in B–D (bottom), while black star denotes CA1 electrode as in B–D (top). B (top): Photomicrographs of a representative recording site in septal CA1. Middle photomicrograph shows a close-up (20×) of electrode tip, as denoted by the black arrow. The right photomicrograph depicts the next coronal section for verification that the electrode tract ends. The septal CA1 tract ends in slm. The raw, unfiltered LFP for representative CA1 slm electrode is shown. B (bottom): Same as top (CA1), but for DG. The septal DG tract ends in the gcl. Theta trace for representative DG gcl electrode is shown. C: two-dimensional histogram (density plot) of the relationship between speed and theta amplitude for representative CA1 slm and DG gcl electrodes, as well as speed signal with overlaid theta trace. D: two-dimensional histograms for the relationship between theta amplitude and acceleration/deceleration for the same CA1 slm and DG gcl electrodes (all theta envelope units in 2D histograms = ×10−4; all count units = ×103; all p-values<.0001). Abbreviations: sr = stratum radiatum; slm = stratum lacunosum moleculare; mol = molecular layer; gcl = granule cell layer.

