
Figure 2.
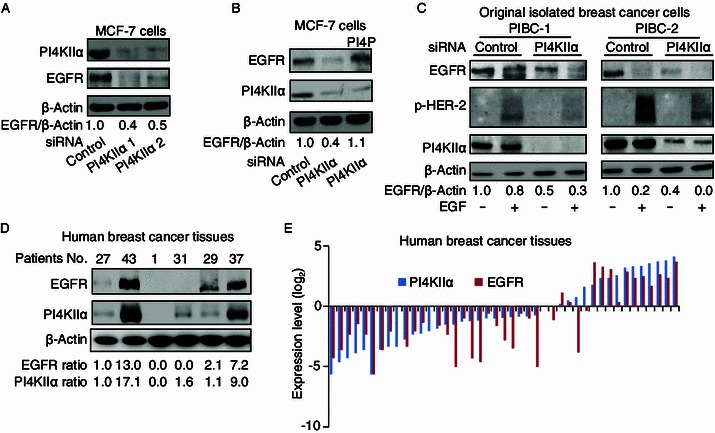
Regulation of EGFR protein levels by PI4KIIα knockdown. (A) Effect of PI4KIIα inhibition on EGFR protein levels. MCF-7 cells were transfected with either control siRNA or PI4KIIα siRNA (PI4KIIα 1 and PI4KIIα 2 represent two siRNAs targeting different sites of the PI4KIIα mRNA), and indicated proteins measured by Western blot. (B) The rescue effect of PI4P on EGFR levels following PI4KIIα knockdown. (C) Effect of PI4KIIα knockdown on EGFR protein levels in primary isolated breast cancer cells. PIBC1 and PIBC2, were transfected with control or PI4KIIα siRNA, and then treated with EGF for 10 min, prior to Western blotting for proteins indicated. All results presented above represent data from three independent experiments. (D) Representative examples of PI4KIIα and EGFR expression in breast cancer tissues detected by immunoblotting. (E) Statistical analysis of PI4KIIα and EGFR expression in breast cancer tissues. Protein log2 fold changes (on the y axis) are compared to the protein level of No. 27 patient