
Figure 5. Src activation increases in the nucleus in response to OFSS.
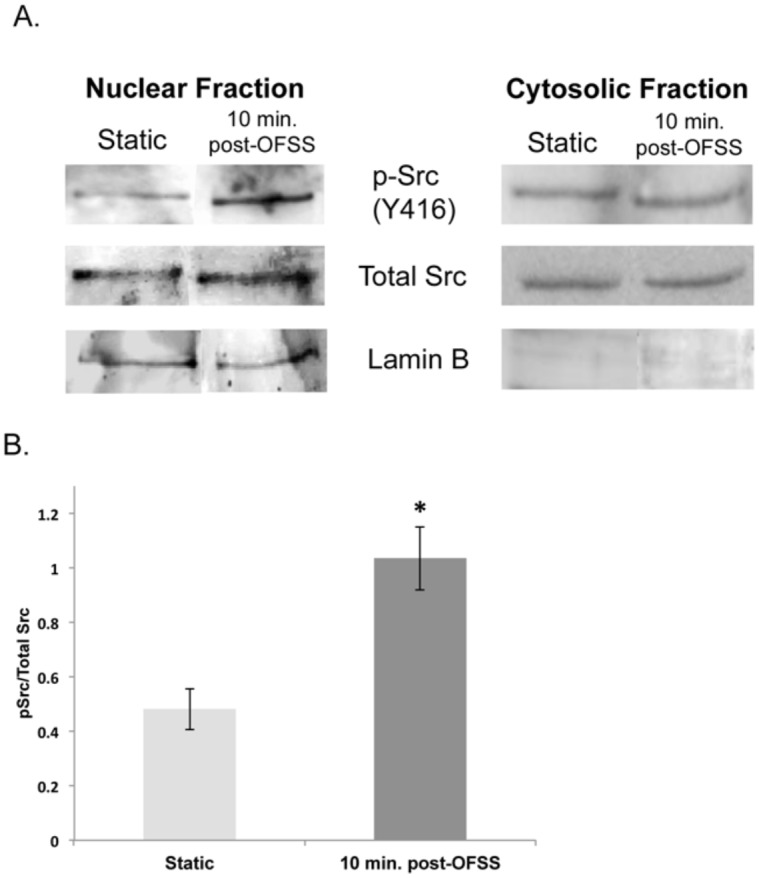
(A) Western blot analysis of nuclear fractionation blotted for Src activation (Y416), total Src and lamin B in MLO-Y4 osteocytes exposed to 5 minutes of OFSS or static culture conditions. (B) Graph represents quantification of Src activation (Y416)/total Src in nuclear fractions. Error bars represent standard error. Statistically significant difference between static and 10 minutes post-OFSS (*p<0.05). An n≥3 were used in the repeated experiments.