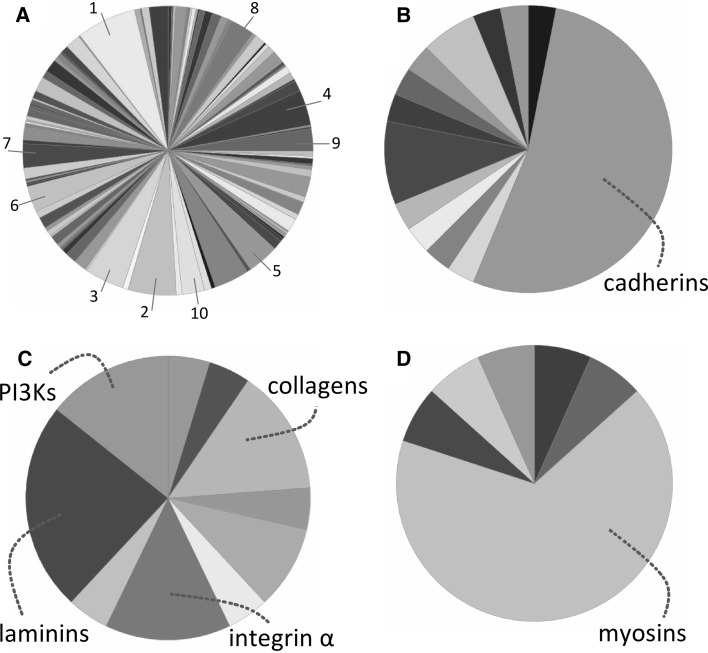
Fig. 1.
Functional clustering analysis of genes with selected rare variants. a Pie chart of the top-ranked pathways with numbers referring to the names of the pathways as indicated in Table 1. b Pie chart of pathway 1 in a, the Wnt signaling pathway. c Pie chart of pathway 3 in a, the integrin signaling pathway. d Pie chart of pathway 6 in a, the nicotinic acetylcholine receptor signaling pathway

