
Figure 3. Western blot analysis of cardiac TH, GAP43 and NGF proteins.
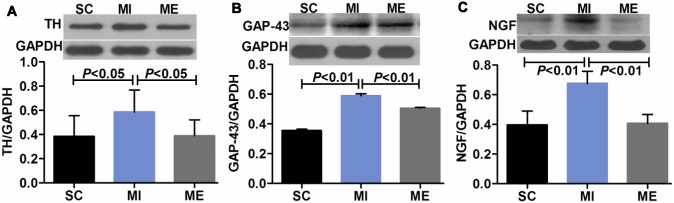
A–C. Western blot analysis of cardiac TH, GAP43 and NGF proteins in the SC, MI, ME groups. The GADPH level was used as an internal control. Western blot analysis showed that cardiac TH, GAP43 and NGF protein expression significantly increased after MI, which was normalized by aerobic exercise.