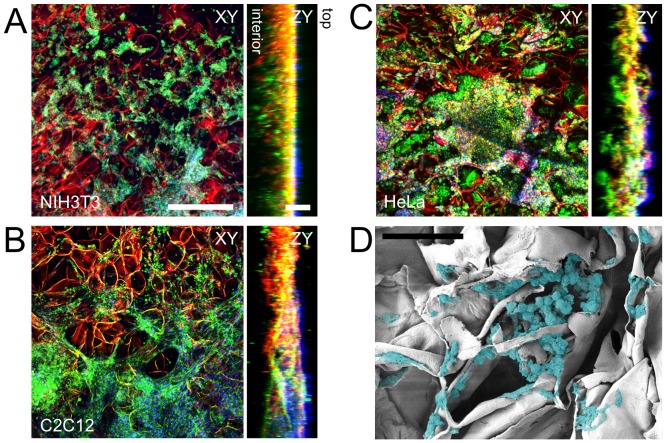
Figure 4. Fixed and stained NIH3T3, C2C12 and HeLa cells cultured on 3D cellulose scaffolds.
Specific fluorescent staining of (A) NIH3T3, (B) C2C12 and (C) HeLa mammalian cells within the cellulose scaffolds and subsequent laser scanning confocal microscopy reveals the cellulose structure (red), mammalian cell membranes (green) and nuclei (blue). Cells were cultured in these scaffolds for four weeks prior to staining and imaging. Confocal volumes were acquired and projected in the XY and ZY plane. The ZY orthogonal views demonstrate the depth of cell proliferation within the cellulose scaffold. The top and bottom surfaces of the scaffold are indicated. Scale bars: XY = 300 µm, ZY = 100 µm. D) SEM image of a cellulose scaffold cross section after being seeded with C2C12 cells that were allowed to proliferate for four weeks. The cells were digitally colourized in order to increase contrast between the cells and cellulose structure (Scale bar: 50 µm)

