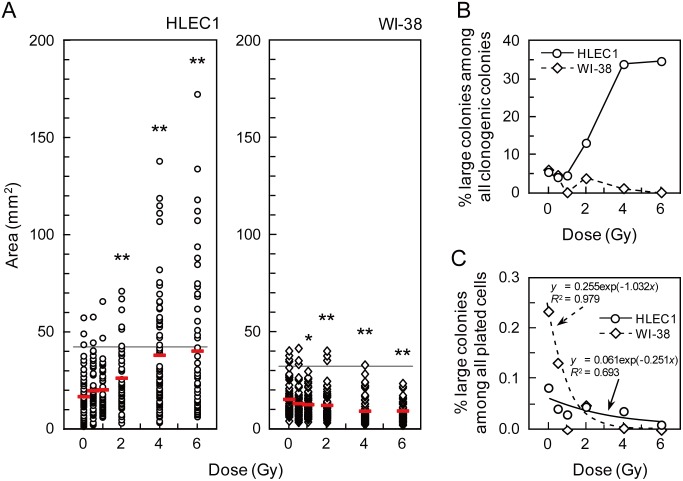
Figure 5. The area of clonogenic colonies.
(A) The area distribution of clonogenic colonies arising from HLEC1 (left panel) and WI-38 (right panel) as a function of dose. The area of clonogenic colonies (45–68 colonies for HLEC1 and 54–93 colonies for WI-38 per dose point) was measured as described in Figure S1. Red bars indicate the means at each dose point. The horizontal lines indicate the mean+2SD area in sham-irradiated controls (41.7 mm2 for HLEC1 and 31.7 mm2 for WI-38). *0.01≤p<0.05 and **p<0.01 compared with sham-irradiated controls. See Figure S2 for the frequency distribution replotted as a function of the area. (B) The fraction of clonogenic colonies exceeding the mean+2SD area of sham-irradiated controls among all clonogenic colonies analyzed. (C) The fraction of clonogenic colonies exceeding the mean+2SD area of sham-irradiated controls among all plated cells. Curves were fitted to the exponential equation, though the data points for 1 Gy and 6 Gy for WI-38 were excluded because of zero values. R 2, correlation coefficient square. When the intercept of the exponential curve for WI-38 was changed from 0.255 to 1, its slope changed from 1.032 to 0.716, and changed from 0.979 to 0.994. For Figure 5B and 5C, circles with solid lines and diamonds with dotted lines indicate the data for HLEC1 and WI-38, respectively.

