
Figure 1.
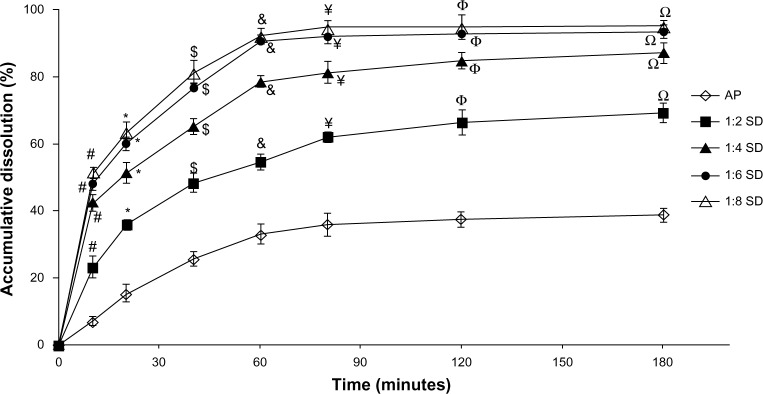
The dissolution profiles of AP and SDs at different AP/CNP ratios of 1:2, 1:4, 1:6, and 1:8.
Notes: Each point represents the mean ± standard deviation (n=3). #P<0.01 versus pure AP at 10 minutes; *P<0.01 versus pure AP at 20 minutes; $P<0.01 versus pure AP at 40 minutes; &P<0.01 versus pure AP at 60 minutes; ¥P<0.01 versus pure AP at 80 minutes; ΦP<0.01 versus pure AP at 120 minutes; ΩP<0.01 versus pure AP at 180 minutes.
Abbreviations: AP, apigenin; SD, solid dispersion; CNP, carbon nanopowder.