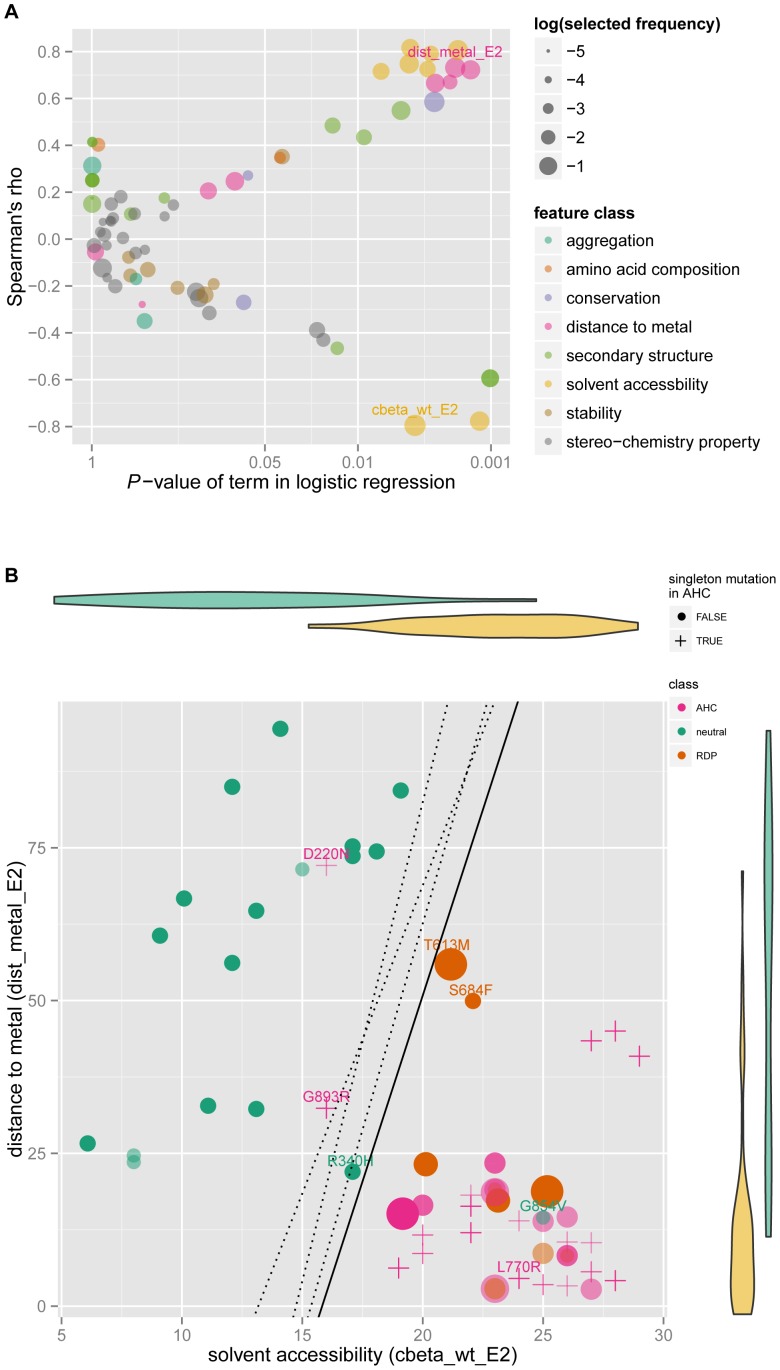
Figure 2. Discriminative features and classifier for disease-associated mutations versus neutral variants.
(A) Discriminative effect and correlation of each molecular feature based on training dataset. X-Y axes demonstrated correlation between each feature with variant category through logistic regression analysis and Spearman's rho calculation. The dot color represented the class the molecular feature belonged to, and size meant selected frequency in robust feature selection procedure. The selected features were labeled. (B) Classifiers and its prediction result. X-Y axes represented the selected features ‘cbeta_wt_E2’ (the number of β carbon atoms around the mutated site within 10 Å in E2 wildtype protein structure) and ‘dist_metal_E2’ (the minimum distance from mutated site to metal ion binding pocket in E2 wildtype protein structure; unit Å), belonging to ‘solvent accessibility’ and ‘distance to metal site’ class respectively. The violin diagrams demonstrated the distribution of each feature in each variant category. The crosses indicate singleton mutations in AHC, while dots were mutations used in the train dataset. The size of the dots represented precision weights. The solid line was corresponded to the simplest model without any weight, while the three dotted lines from left to right according to the intercept on X axis were the decision boundaries of three different models (see Methods section): using all mutations for training; weighting train dataset with frequency weight; weighting train dataset with precision weight.

