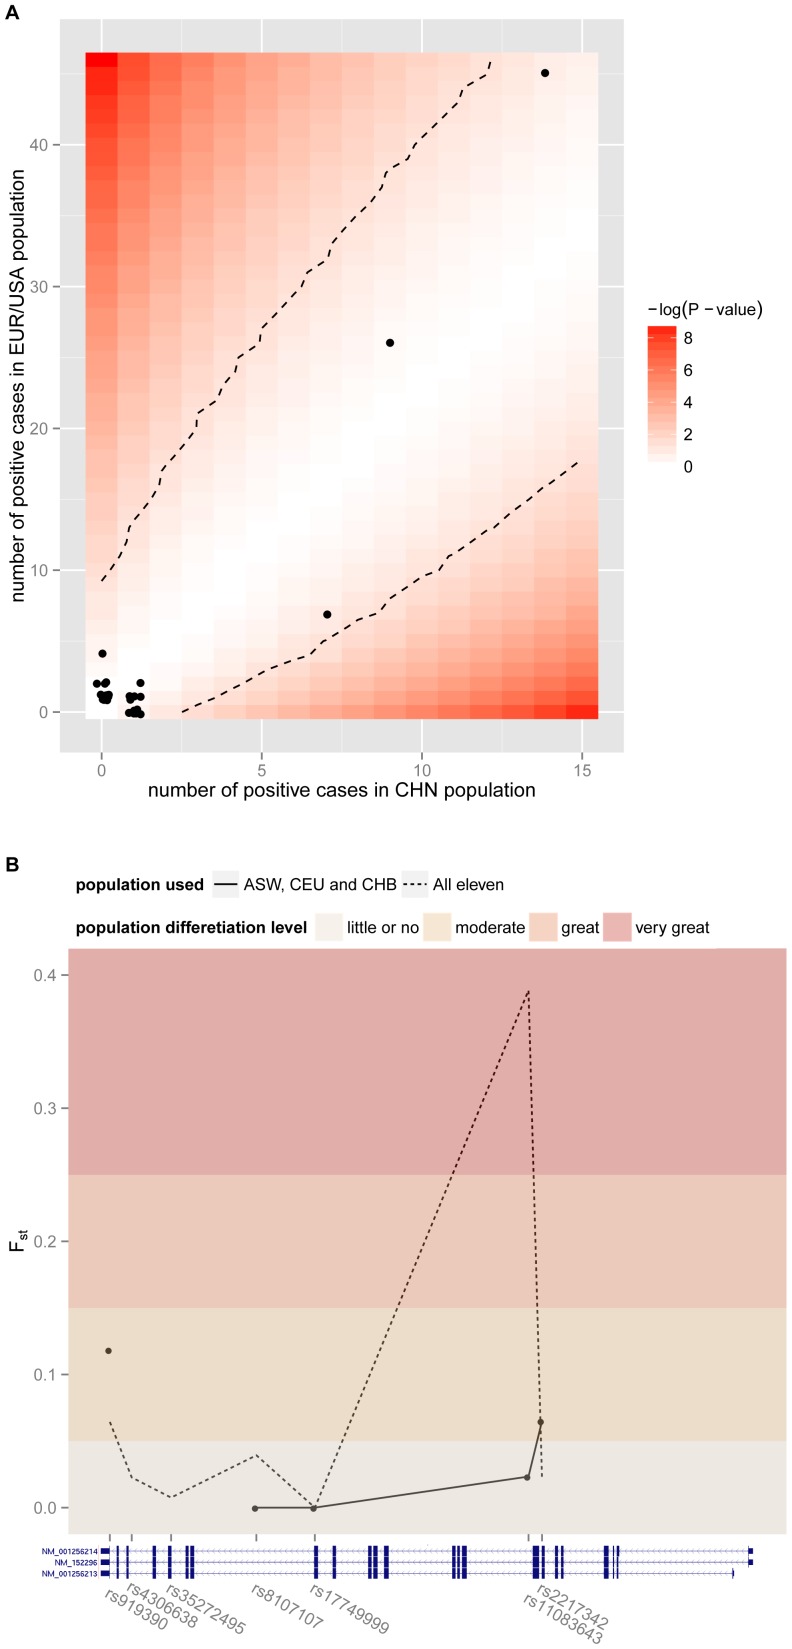
Figure 3. Mutation frequency comparison of ATP1A3 between Chinese and European/American populations.
(A) Mutation frequency comparison of AHC. Each dot represented one mutation, whose value of X axis was the number of cases carrying this mutation out of 47 Chinese AHC cases, and value of Y axis was the number of carriers out of 106 European/American AHC cases. The background showed the P-value of Fisher's exact test and dashed line represented 0.05 significant level. (B) Overall population difference of ATP1A3 according to Fst values. The dots and solid line represented Fst values of informative SNPs in the populations of Chinese, European and American, and the dotted line represented all eleven populations in HapMap Project. The threshold of Fst were set according to S. Wright [40].

