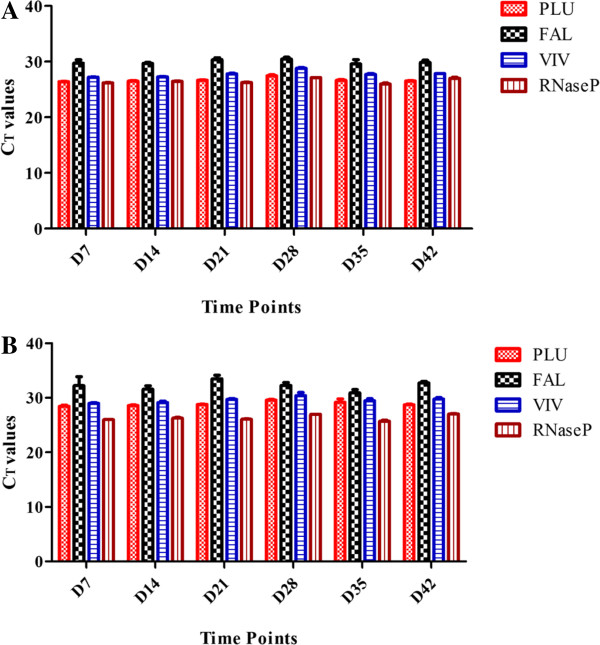
Figure 2.
Performance of individual assay targets over time. Data showing the CT mean ± SD for individual assay targets for all test conditions. Panel A shows data using DNA at high concentrations and panel B shows data using DNA at low concentration. For example, on D7, PLU assay is showing mean CT values and the SD for each ambient temperature tested on that day. Low SD indicates different ambient temperatures which the assay was stored in did not impact the performance of the assay using either low or high DNA concentration. For FAL assay however, at low DNA concentration, the SD was larger than that of high DNA concentration indicating at low DNA concentration, the FAL assay performed with lower precision when the different ambient temperature being tested were compared.

