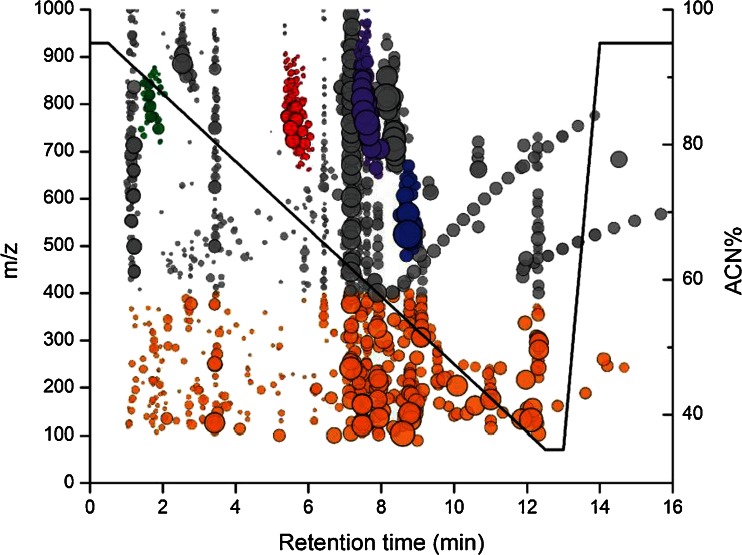
Fig. 3.
The 2,125 endogenous metabolite features detected in 3 × 10⁵ murine macrophage extracts after data reduction. The radius of the data markers (filled circle) reflected the relative abundances of the metabolite features over a dynamic range of 5 × 10⁴. Small metabolites (90–400 m/z) in orange, PGs in green, PEs in red, PCs in purple and lyso-PCs in blue were highlighted. The HILIC gradient was labelled with a black line with reference to percentage acetonitrile

