Fig. 4.
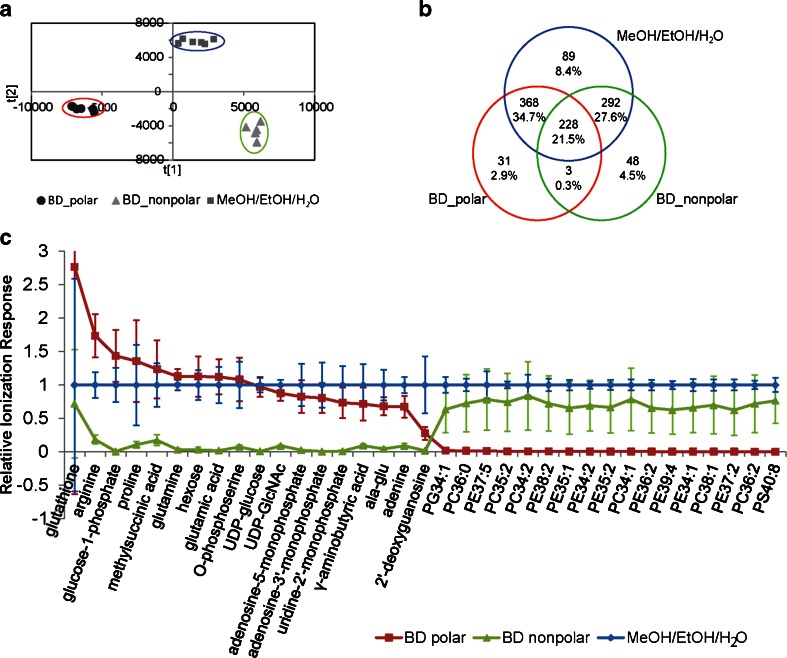
The metabolome coverage of S. meliloti of the 1,059 endogenous metabolite features found in at least one set of BD polar, BD nonpolar or MeOH/EtOH/H2O extracted samples. Extracts were performed in sextuplicate and analysed independently by HILIC-TOF-MS in both ESI+ and ESI− modes. The ionization responses of the metabolite features were normalized using internal standards. a OPLS-DA score plot comparing the endogenous metabolome coverage of S. meliloti extracts attained from three different extraction methods with R 2 X(cum) = 0.926, R 2 Y(cum) = 0.986 and Q 2(cum) = 0.936. b The quantity of metabolite features that were uniquely identified and shared between BD polar, BD nonpolar and MeOH/EtOH/H2O extracted samples was listed in the Venn diagram with their estimated percentage share of the total detectable metabolome. c The normalized ionization responses of identified metabolites with varying polarities. The ionization responses from MeOH/EtOH/H2O extracts were set to one as references. Polar metabolites were mostly extracted in BD polar, and lipids were seen exclusively in BD nonpolar; however, all metabolites were detected in MeOH/EtOH/H2O. Error bars corresponded to two standard deviations. UDP, uridine diphosphate; GlcNac, N-acetylglucosamine

