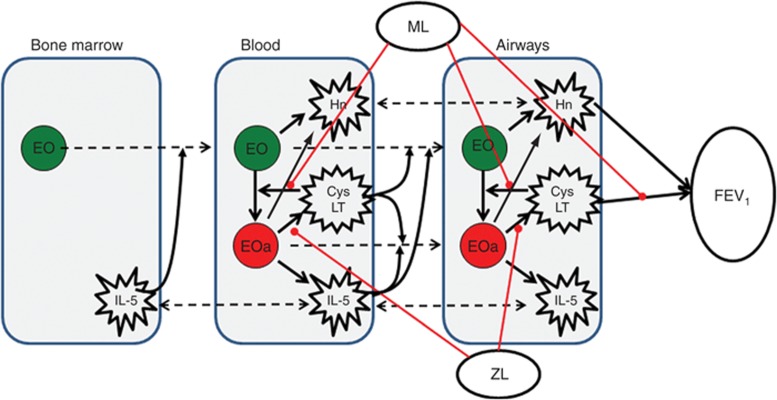
Figure 1.
Schematic representation of processes considered in the model. Broken arrows signify transport across tissues. Solid arrows signify production/synthesis/stimulation process. Lines (red) identify points of therapeutic intervention. CysLT, cysteinyl leukotrienes; EO, non-activated eosinophils; EOa, activated eosinophils; FEV1, forced expiratory volume in 1 s; Hn, histamine; IL-5, interleukin-5; ML, montelukast; ZL, zileuton.

