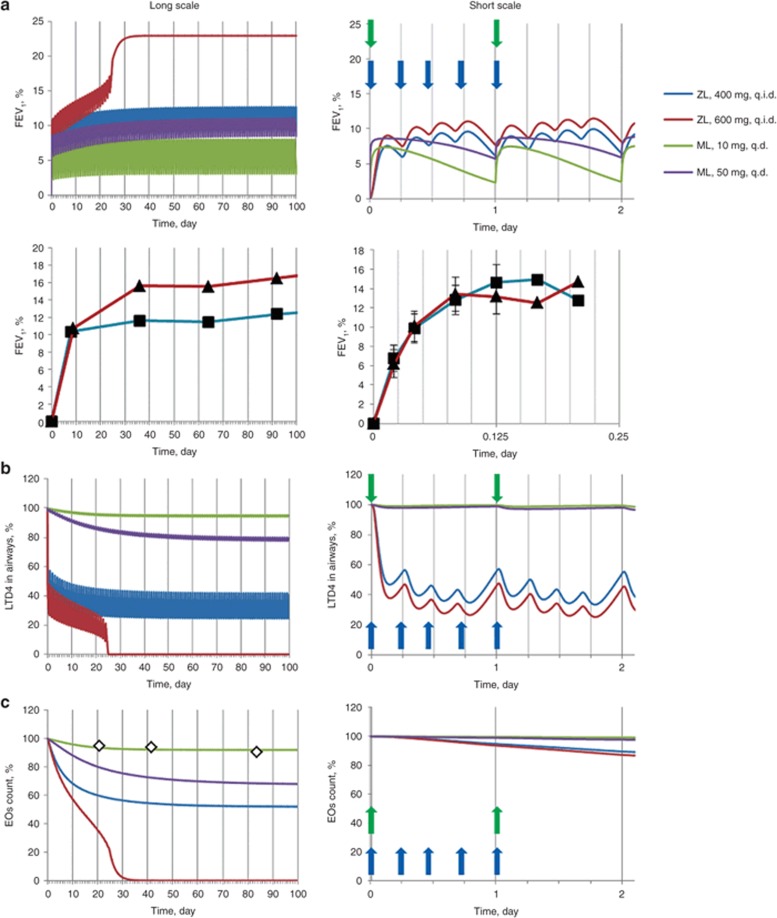
Figure 2.
Simulated and clinically measured response to administration of labeled dosages of zileuton (ZL) and montelukast (ML) presented in longer and shorter time scales. Solid lines represent simulations, symbols (squares, triangles, and diamonds) represent clinical observations. Dependence of (a) forced expiratory volume in 1 s (FEV1), (b) airways LTD4 concentration, and (c) airways eosinophils (EOs) number on time under condition of ZL and ML administration. Four hundred milligrams (blue curve, closed squares) and 600 mg (red curve, closed triangles) of ZL is administered four times a day (q.i.d.); 10 mg (green curve, open diamonds) and 50 mg (violet curve) of ML is administered q.d. All simulated characteristics are expressed as percentage from baseline. Clinically measured data on FEV1 response to ZL were taken from Liu et al.2 Vertical blue and green arrows indicate time of administration of ZL during the first day of therapy and ML during two initial days of therapy. q.d., once daily.

