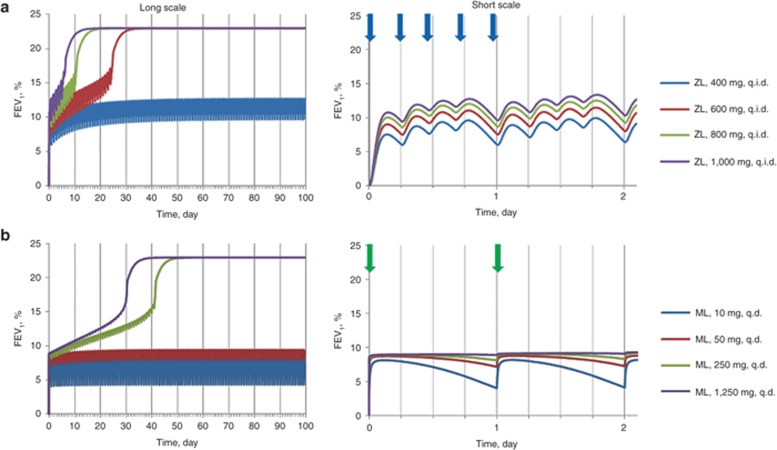
Figure 3.
Simulated response to administration of high dosages of zileuton (ZL) and montelukast (ML) presented over chronic and acute time scales. Dependence of FEV1 (% from baseline) on time under condition of (a) ZL q.i.d. and (b) ML q.d. administration: blue, red, green, and violet curves correspond to 400, 600, 800, 1,000 mg of ZL and 10, 50, 250, 1,250 mg of ML, respectively. Vertical blue and green arrows indicate time of administration of ZL during the first day of therapy and ML during two initial days of therapy, respectively. FEV1, forced expiratory volume in 1 s; q.d., once daily; q.i.d., four times a day.

