
TABLE 2.
Treatment response in both groups at certain time intervals
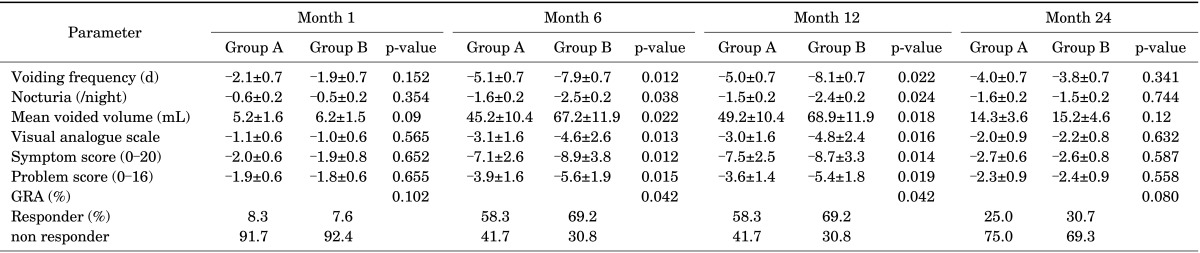
Values are presented as mean±standard deviation.
Group A, direct instillation; group B, instillation via electromotive drug administration; GRA, global response assessment.
Official websites use .gov
A
.gov website belongs to an official
government organization in the United States.
Secure .gov websites use HTTPS
A lock (
) or https:// means you've safely
connected to the .gov website. Share sensitive
information only on official, secure websites.
Treatment response in both groups at certain time intervals
Values are presented as mean±standard deviation.
Group A, direct instillation; group B, instillation via electromotive drug administration; GRA, global response assessment.