
Figure 6.
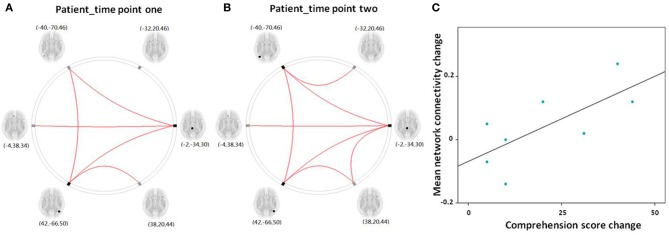
(A,B) Graphical presentation of the left frontoparietal network in aphasic patient in time point one and two separately identified by network connectivity analysis analysis. A threshold of FDR-corrected P < 0.05 was applied. (C) Scatter plots depict the relationship between the mean left frontoparietal network connectivity change and the comprehension score change in patient group between time point one and two.