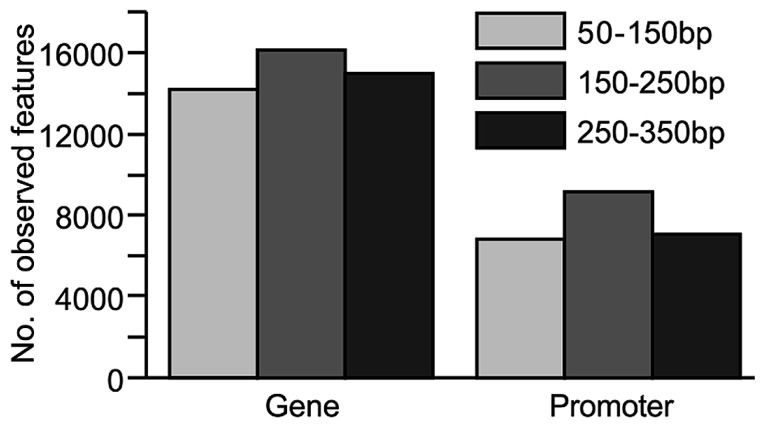
FIGURE 3.
Comparison of coverage at genomic features (genes and promoter regions) from sequence data generated from libraries constructed from various fragment sizes (50–150, 150–250, and 250–350 bp). For inclusion, the genomic feature had to contain at least three CpG sites with ≥10x coverage. Promoter regions were defined as 2 kb upstream of the transcription start site.

