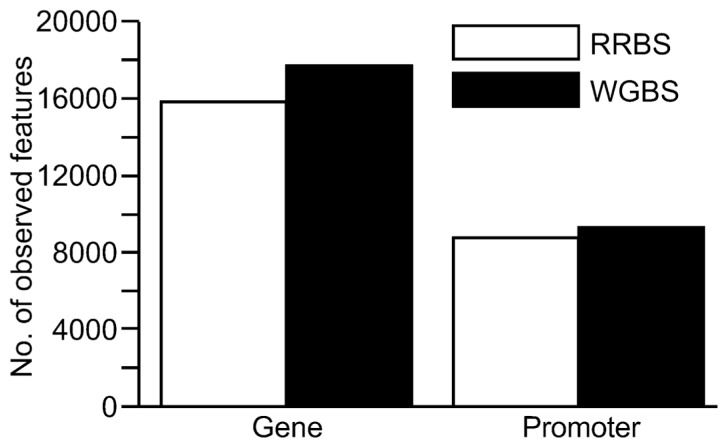
FIGURE 4.
Comparison of coverage at genomic features (genes and promoter regions) from sequence data generated from a reduced representation bisulfite sequencing (RRBS) library versus a whole genome bisulfite sequencing (WGBS) library. For inclusion, the genomic feature had to contain at least three CpG sites with ≥10x coverage. Promoter regions were defined as 2 kb upstream of the transcription start site.

