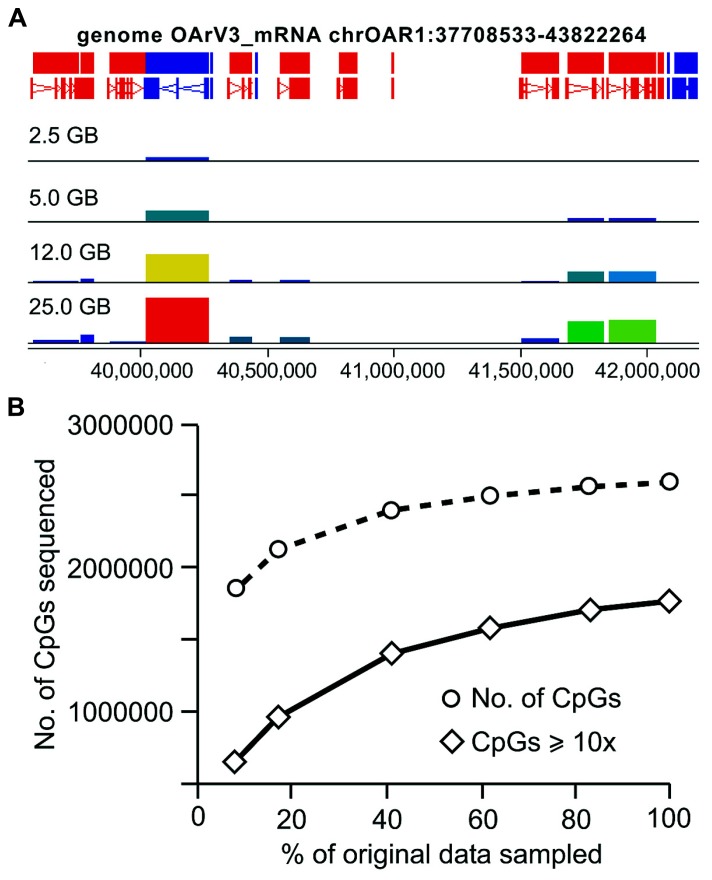
FIGURE 5.
CpG coverage generated from RRBS when smaller amounts of data are available for analysis. RRBS data were randomly sampled from the original fastq file to create smaller data sets, (A) Seqmonk screen shot illustrating CpG site coverage across selected genes on chromosome 1, bar height represents a count of CpG coverage, illustrating inclusions of increasing number of genes analyzed as the number of sequences included increases; (B) The number of CpGs covered in these sequentially smaller datasets was identified, in addition to the number of CpGs with at least 10x coverage.

