
Figure 3.
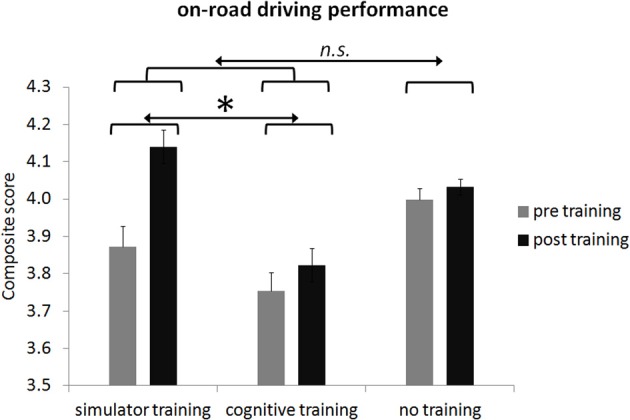
Group means of overall on-road performance before and after participation broken down for the three groups. Error bars in plots indicate the standard error of the mean. Please note dimension is arbitrary. Note: n.s., not significant; * < 0.05.