
Figure 4.
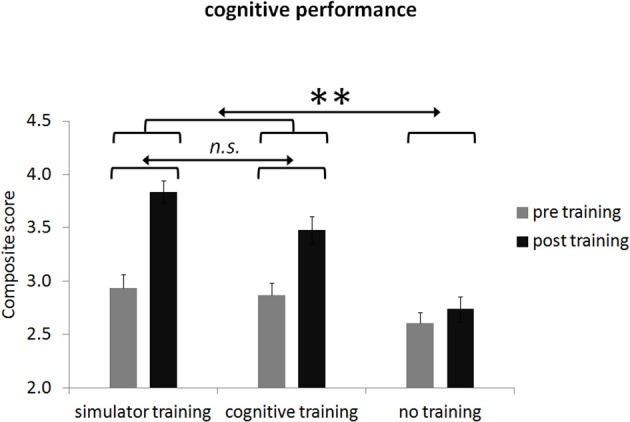
Group means of overall cognitive performance before and after participation broken down for the three groups. Error bars in plots indicate the standard error of the mean. Please note dimension is arbitrary. Note: n.s., not significant; ** < 0.01.