
Figure 6.
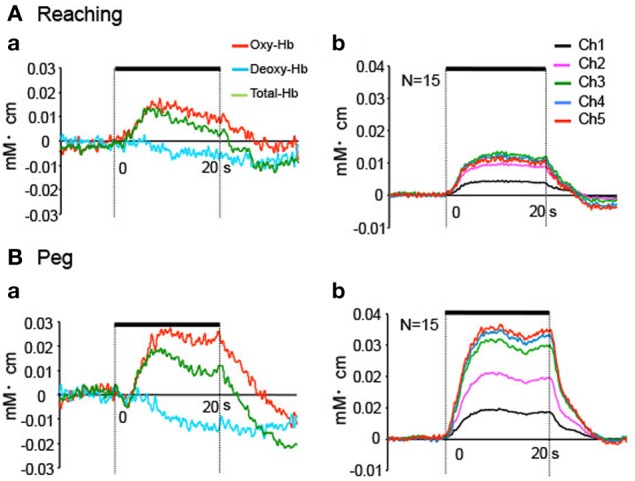
Hemodynamic responses during the task phase in Experiment II. (A) Hemodynamic changes in the reaching task in 1 subject (a) and the averaged data of 8 repetitions (all blocks) for all subjects (b). Only Oxy-Hb data are indicated in (b). (B) Hemodynamic changes in the peg task in 1 subject (a) and the averaged data of 8 repetitions (all blocks) for all subjects (b). Only Oxy-Hb data are indicated in (b). Thick lines indicate the task phase.