
Figure 3.
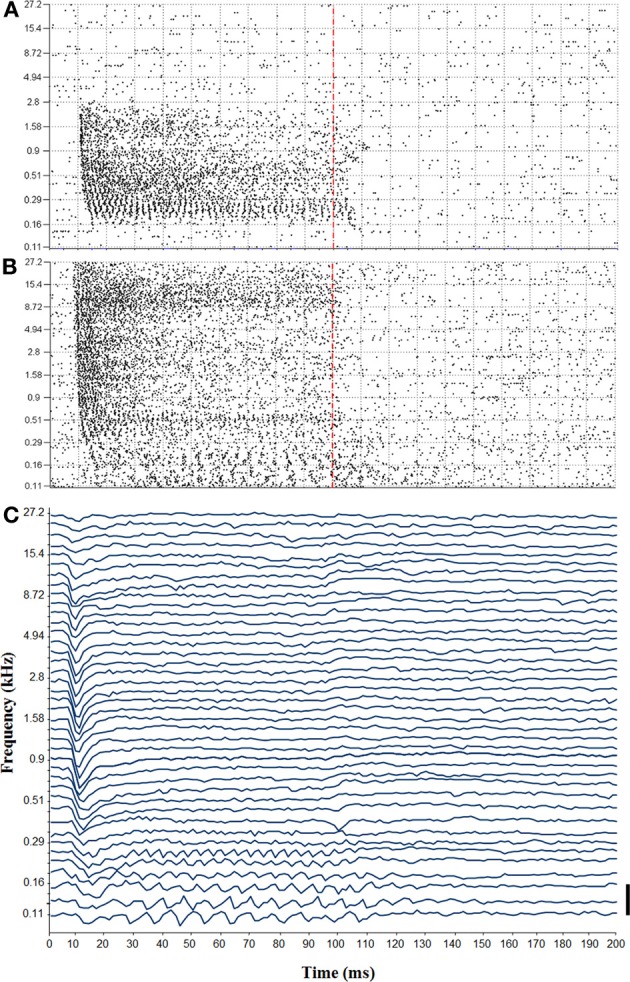
(A) Tuning curve recorded from the left red nucleus. Vertical dashed line indicates the end of the tone bursts. (B) Tuning curve from the right red nucleus. Note the temporal coding showing phase locking to low frequency tones. (C) Auditory-evoked potential recorded in responses to tone bursts from the right red nucleus (bar = 100 μV).