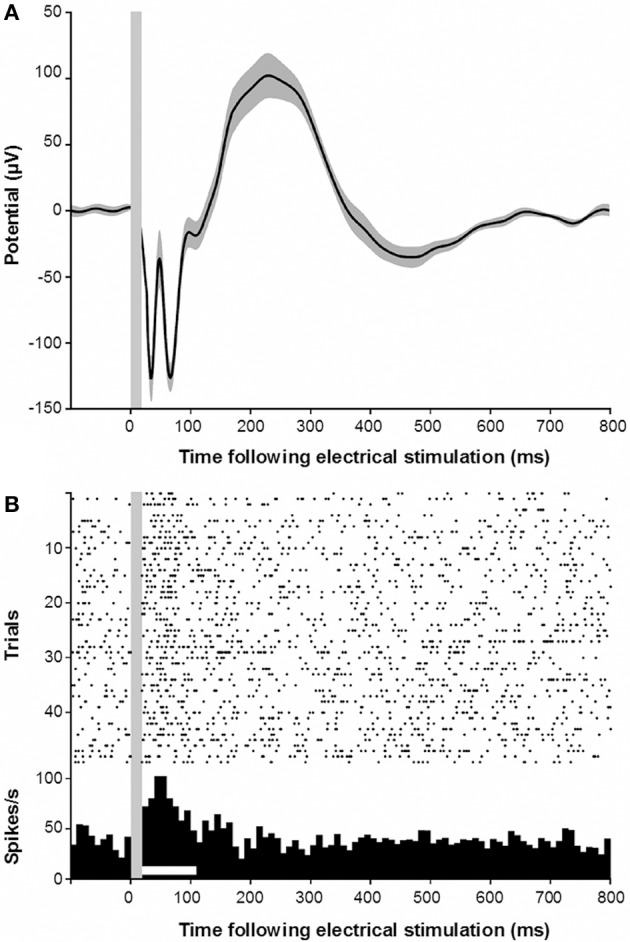
Figure 5.

(A) Electrically evoked potential recorded in the auditory cortex following electrical stimulation of the red nucleus. Gray shading indicates s.e.m. Gray vertical bar indicates the stimulus artifact. (B) Electrically evoked multiunit responses in the auditory cortex following electrical stimulation of the red nucleus.
