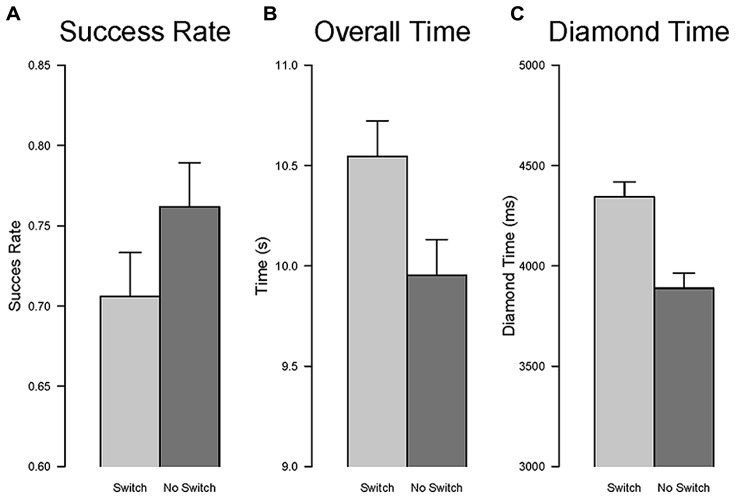
FIGURE 9.
Task switch effect. The comparison between repetition and switch conditions is shown for success rate (A), overall time to complete the task (B), and time to collect the fist diamond (C). Error bars are within-subjects confidence intervals calculated with the method of Morey (2008).

