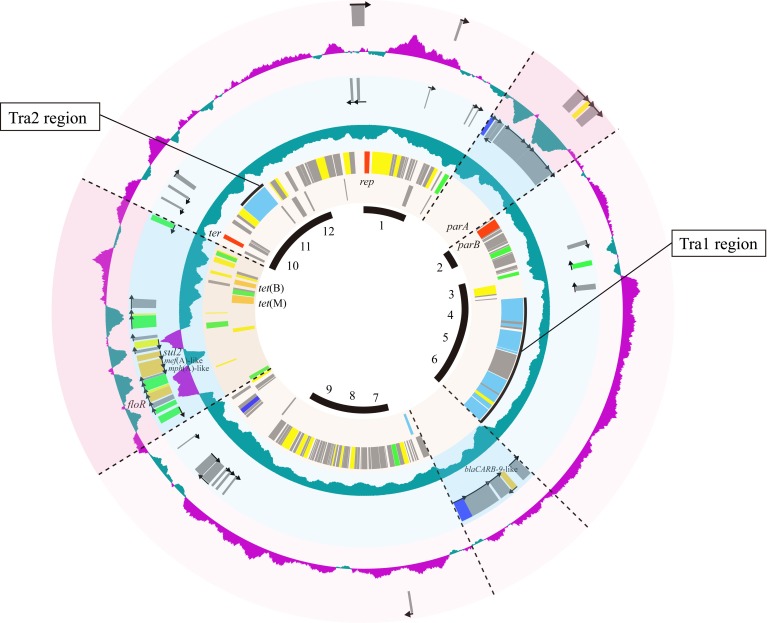
Figure 3.
Circular representation of pAQU1 backbone and specific genes for pAQU2 and pAQU1, respectively. Circles from inside to outside: 1, Putative pAQU back bone regions, 2 and 3, shared CDSs between pAQU1 and pAQU2; 5 and 6, CDSs specific for pAQU1; and 8 and 9, CDSs specific for pAQU2. Each of CDSs inside and outside of the circle coded counter-clockwise and clockwise, respectively. The 4th and 7th circle indicates GC content of pAQU1 and pAQU2 where purple shows upper GC value above the center line and green shows lower GC value below the center line. Putative functions of the products of the CDSs are indicated in color: red, replication, partition and termination; light blue, conjugative transfer; blue, integration; green, transposition; orange, antibiotic resistance; yellow, other functions and gray, unknown function.

