
Figure 2.
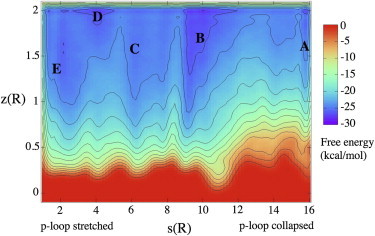
FES reconstructed as a function of s and z of the p-loop equilibrium. The energy separation between contours is 2 kcal/mol. Basins A–E are referring to the conformations in Fig. 3, a–e. To see this figure in color, go online.
Official websites use .gov
A
.gov website belongs to an official
government organization in the United States.
Secure .gov websites use HTTPS
A lock (
) or https:// means you've safely
connected to the .gov website. Share sensitive
information only on official, secure websites.
FES reconstructed as a function of s and z of the p-loop equilibrium. The energy separation between contours is 2 kcal/mol. Basins A–E are referring to the conformations in Fig. 3, a–e. To see this figure in color, go online.