
Figure 4.
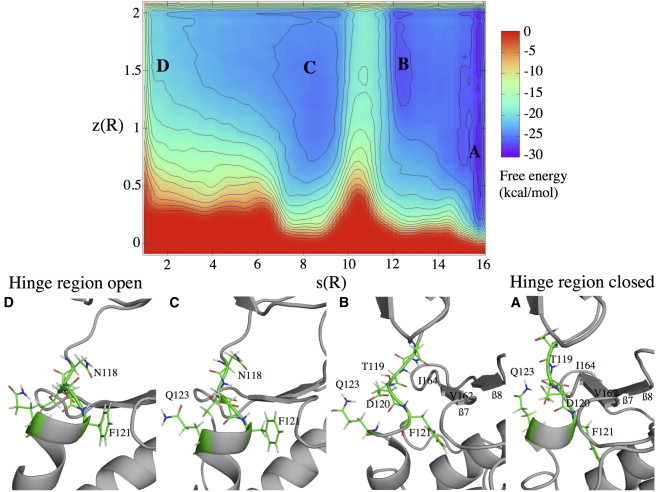
FES reconstructed as a function of s and z of the hinge region equilibrium. The energy separation between contours is 2 kcal/mol. Basins A–D are referring to the conformations below the FES. Figures were prepared with PYMOL (Delano Scientific, http://www.pymol.org). To see this figure in color, go online.