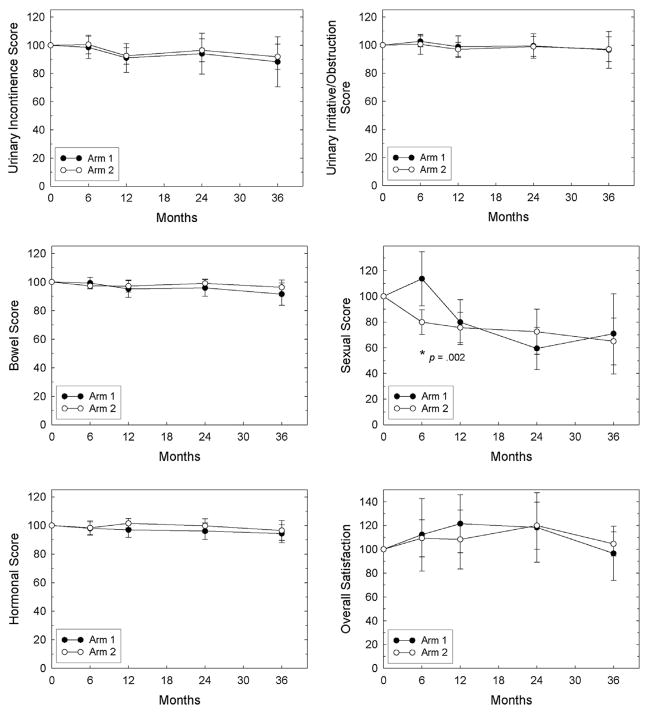
Fig. 1.
EPIC scores. Mean ± 95% confidence interval values are plotted for each arm. Domain scores at 6, 12, 24, and 36 months were normalized to the patient’s own baseline value (defined as 100%) before the mean for each arm was determined. Mean raw scores for each domain at baseline are shown in Table 1. *Indicates significant differences between the arms, and the P value is shown. EPIC = Expanded Prostate Cancer Index Composite.

