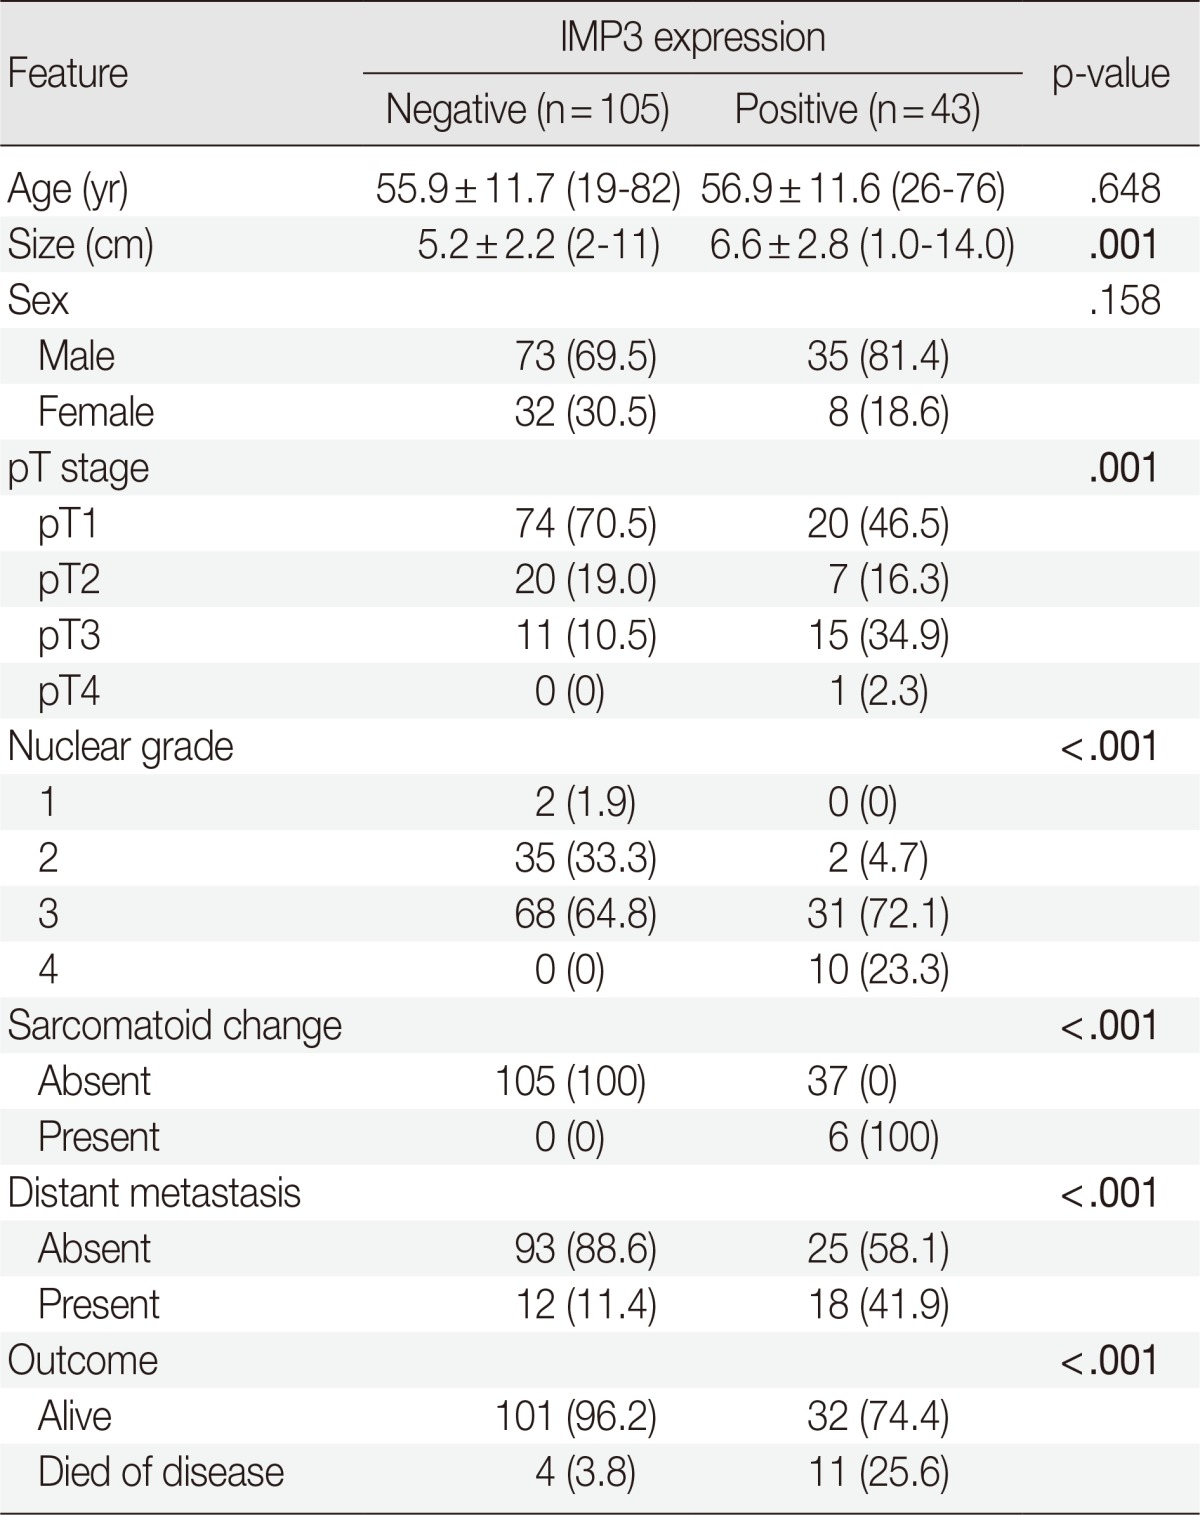
Table 1.
Comparison of clinicopathologic features by IMP3 tumor expression for patients with clear cell renal cell carcinoma

Values are presented as mean±standard deviation (range) or number of patients (%).
The bold values indicate a statistically significant difference (p<.05).
IMP3, insulin-like growth factor II mRNA-binding protein 3.
