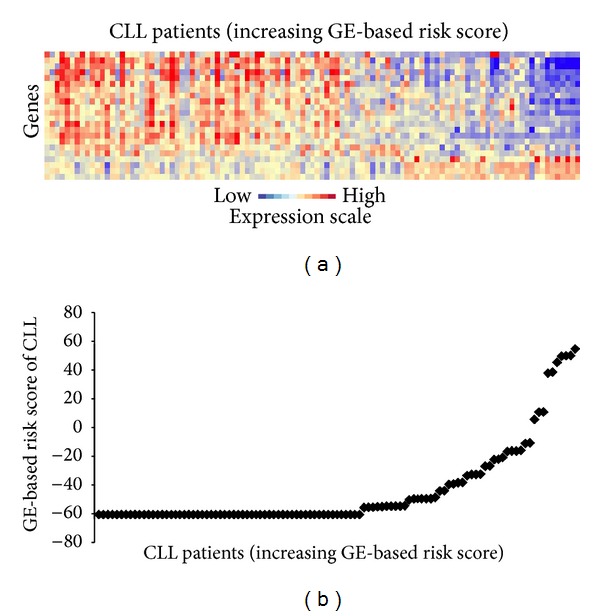
Figure 1.

GE-based risk score in CLL patients. (a) Clustergram of genes ordered from best to worst prognosis. The level of the probe set signal is displayed from low (deep blue) to high (deep red) expression. (b) CLL patients (n = 107) were ordered by increasing GE-based risk score.
