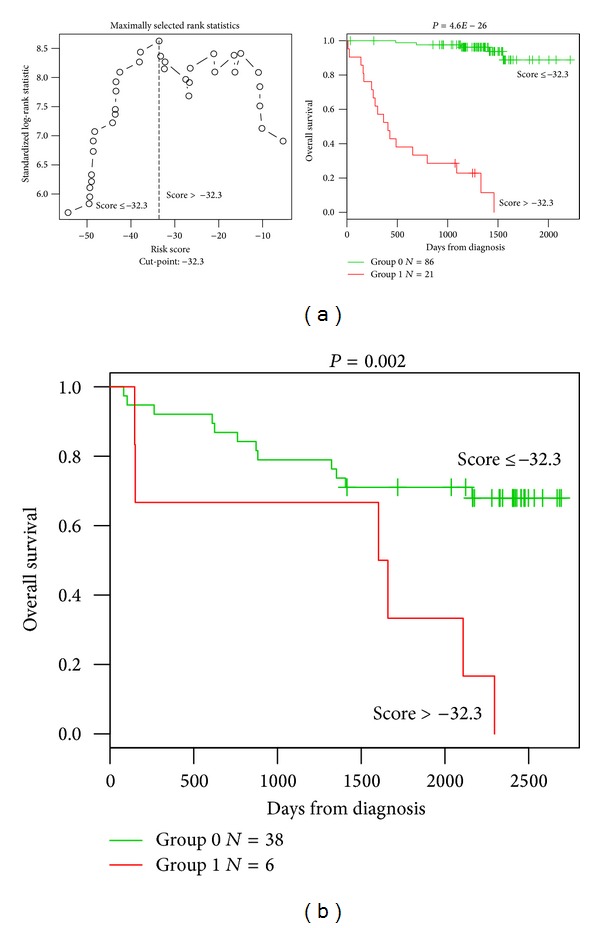
Figure 2.

Prognostic value of GE-based risk score in CLL patients. (a) Patients of the training cohort (n = 107) were ranked according to increasing GE-based risk score and a maximum difference in OS was obtained with a score = −32.3, splitting patients into a high risk (19,6%) and a low risk (80,4%) groups. (b) The prognostic value of GE-based risk score was assayed on an independent cohort of 44 patients (validation cohort). The parameters to compute GE-based risk score of patients in the validation cohort and the proportions delineating the 2 prognostic groups were those defined with the training cohort.
