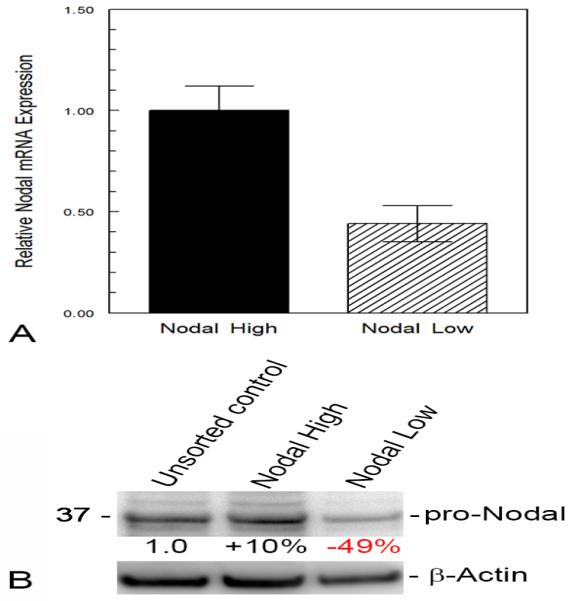
Figure 3.

C8161 cells were treated with Nodal mRNA SmartFlares for 16 hours, then sorted into subpopulations based on a high or low fluorescent signal representing Nodal expressing (Nodal High) and Nodal deficient (Nodal Low) subpopulations using a BD Bioscience FACSAria II Cell Sorter. The relative expression of Nodal mRNA in the two subpopulations was determined by real-time polymerase chain reaction (RT-PCR) assay (A) and the relative expression of Nodal protein (detected at 39 kilodaltons as pro-Nodal) determined by Western blot analysis (B). The differences in pro-Nodal Protein in the High and Low Nodal sorted cells was measured densitometrically relative to the unsorted cells after correction for protein loaded in each lane using β-Actin protein as a control.
