
Figure 5.
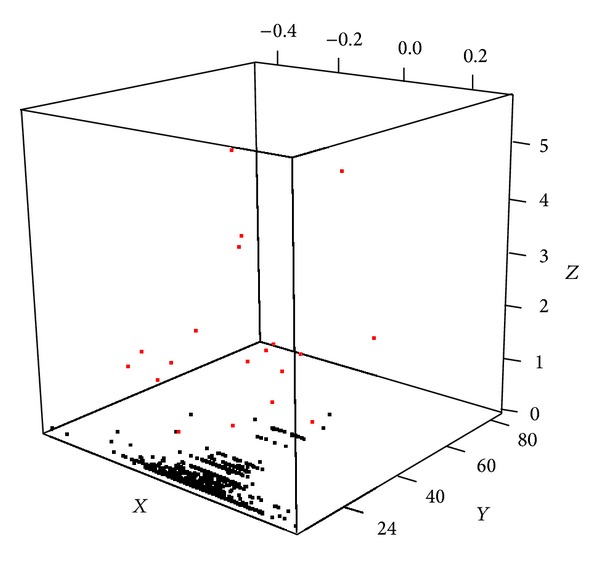
Multiple genes' mutational influence on mRNA expression at pathway level (X-axis). X: averaged pathway level difference of mutation having group minus nonhaving group. Y: number of samples having summarized multigene mutational event. Z: −log10p score, where p is from t-test of pathway statistics between mutational event having group versus nonhaving group. Red: mutation event where its influence on pathway level is significant (FDR q value < 0.25).