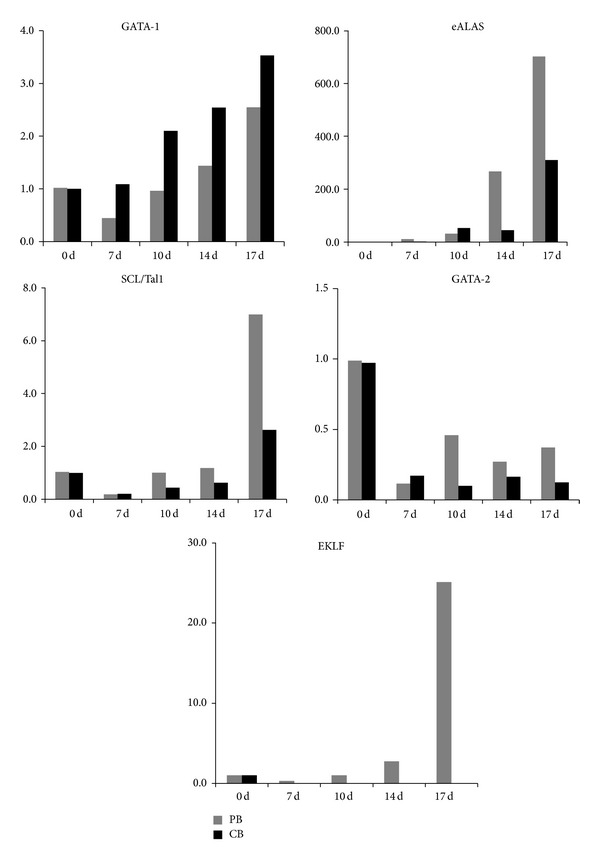
Figure 4.

Erythrocyte-specific gene expression in mPB and CB cells. At the end of each phase of culture, cells were harvested, and total RNA was extracted for quantitative PCR. The expression of GATA-1, GATA-2, eALAS, EKLF, and SCL/Tal1 was measured by real-time PCR. The results show an increasing pattern for the GATA-1 transcript and a decreasing pattern for GATA-2, which did not significantly differ between mPB and CB cells. EKLF, eALAs, and SCL/Tall expression levels increased during differentiation but were significantly greater in mPB-derived erythrocytes than in those from CB.
