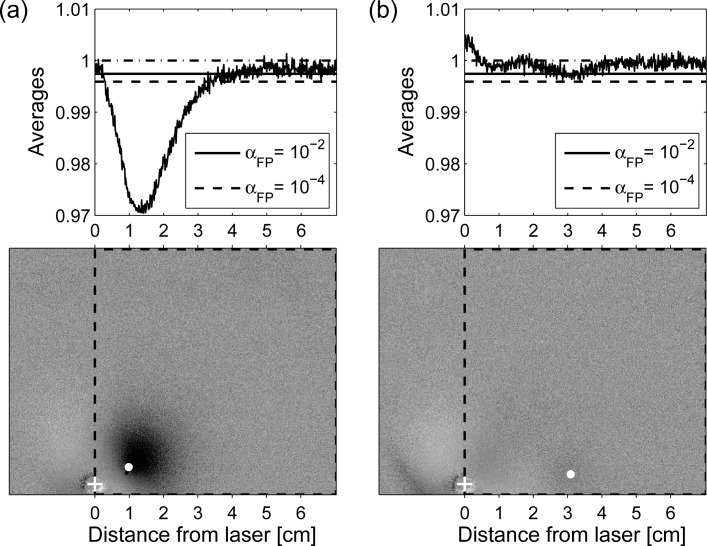
Fig. 10.
Result of applying the criterion of Section 2.6 to two ratio images. a) Corresponding to the case of the phantom rotated by 180° and b) corresponding to the phantom rotated by 140°. Values of the profiles are obtained by averaging all pixels in each column of the region delimited by the dashed contour. Threshold values, T, for different significance levels, are shown as horizontal lines. Inclusion is considered to be “detected” at positions at which the average values are below threshold. White crosses indicate the true position of the laser, and the white dots indicate the actual position of the inclusion inside the phantom.

