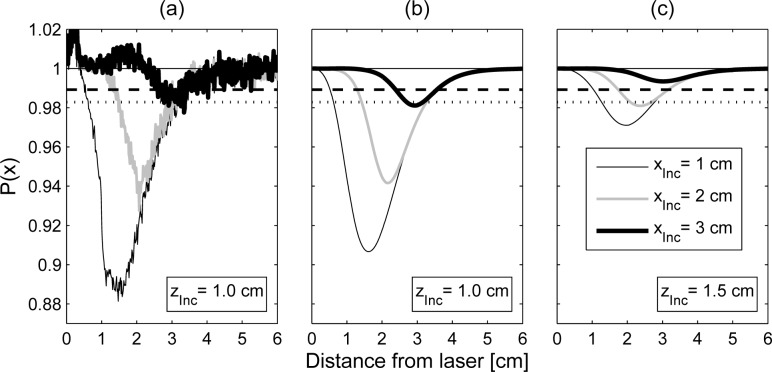
Fig. 11.
Line profiles for three different distances (1cm, 2cm and 3cm) of the 1cm spherical inclusion from the illumination spot. a) Experimental result for a depth of zInc = 1cm obtained by averaging 25 lines of the ratio image. The dashed and the dotted line show the corresponding detection thresholds for significance levels of αFP = 10−2 and 10−4, respectively. b) Theoretical result for the parameters of the experiment in a). c) Theoretical result for an increased depth of the inclusion (zInc = 1.5cm).

