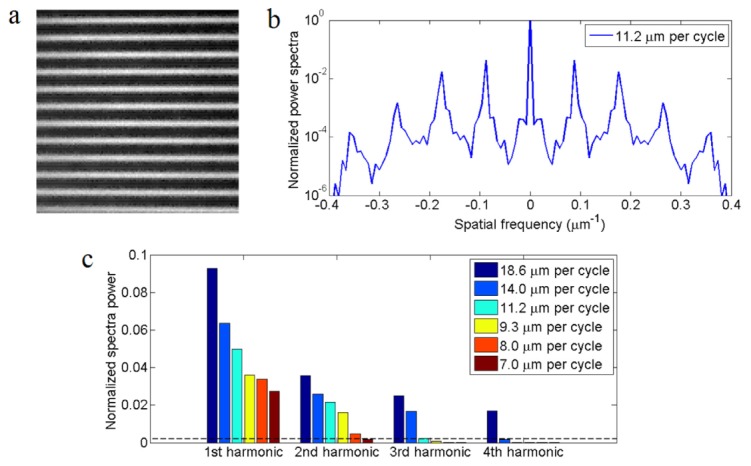
Fig. 8.

Optimizing structured illumination. (a) two-photon image from a fluorescein solution sample, showing a typical structured excitation pattern. (b) Normalized spatial power spectrum of two-photon excitation patterns showing high order harmonics of the pattern. (c) Normalized spectra powers at different harmonic orders of the excitation pattern with different pattern period. The dashed line is the typical noise level of light-sheet images deep inside zebrafish.
